FIG. 5.
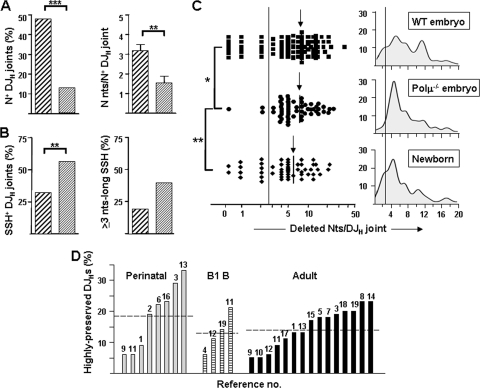
Differential features of Polμ−/− embryo DJH joints. (A) Frequencies of N+ DJH joints (left) and numbers of N nucleotides per N+ sequence (right) in WT (thickly hatched) and Polμ−/− (thinly hatched) embryos. (B) Frequencies of usage of SSH+ DJH joints (left) and of ≥3-nt-long SSH (right) in WT and Polμ−/− embryos. (C) Deleted nucleotides per DJH joint in WT and Polμ−/− embryos and in newborns (a logarithmic scale is used in the x axis on the left). The arrows indicate the mean values for each group. The distribution profiles of DJH joints related to the extents of nucleotide deletions in WT and Polμ−/− embryos and in WT newborns as defined by Gaussian kernel density estimations are shown in the right histograms (a linear scale is used in the x axis). The vertical lines delimit the highly preserved DJHs (≤2 deleted nucleotides). (D) Frequencies of highly preserved DJH joints detected in perinatal pre-B/B, adult B1, and adult pre-B/B cells from healthy mice in an extensive literature review (n = 1,572 DJH joints from 27 series in 19 papers). Each bar corresponds to an independent series of DJHs. The numbers above the bars refer to the original articles, which are listed in Table S2 in the supplemental material. The horizontal lines denote the mean of each group.

