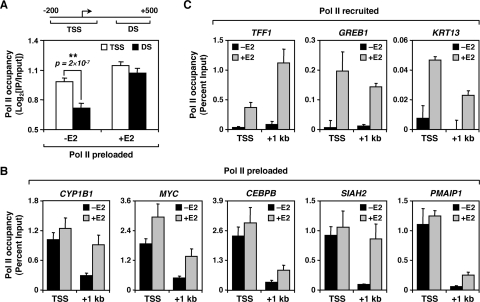
FIG. 3.
Preloaded Pol II localizes to TSS prior to E2 treatment and moves into the body of the gene upon activation. (A) Comparison of Pol II occupancy at the TSS (−200 to +100 bp) and downstream regions (DS; +300 to +500 bp) for all Pol II preloaded genes (n = 171), as determined by ChIP-chip with (+) or without (−) E2 (45 min). The associated t test P value is shown. (B and C) Gene-specific ChIP analyses of Pol II binding at the TSS and +1-kb regions of Pol II recruited (B) and Pol II preloaded (C) E2-stimulated genes with (+) or without (−) E2 (45 min). Each bar represents the mean plus the SEM (n ≥ 3).

