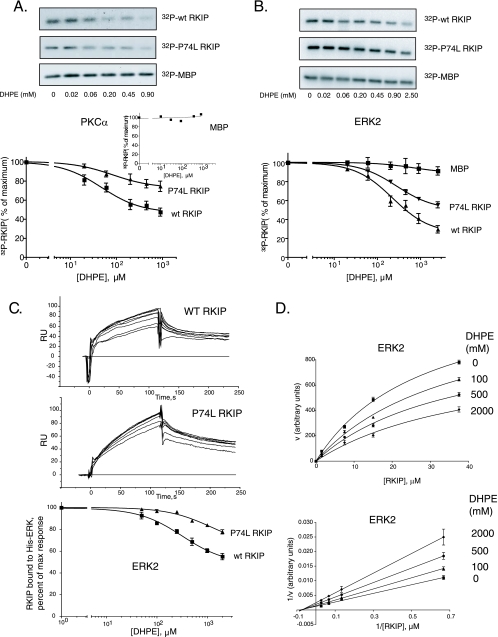
FIG. 6.
DHPE binding decreases wt RKIP and RKIP(P74L) interactions with PKC and ERK2 in vitro. (A and B) Phosphorylation of wt RKIP and the P74L mutant by PKC (A) and ERK2 (B) was carried out in the presence of increasing concentrations of DHPE using RKIP, RKIP(P74L), or MBP as the substrate. (Top) Representative Western blots; (bottom) graphs of results from four independent experiments ± standard deviations. (A, inset) Graph of MBP phosphorylation. (C) The kinetics of wt RKIP (5 μM) and RKIP(P74L) (1 μM) interactions with ERK2 in the presence of increasing concentrations of DHPE (50 to 2,000 μM) were analyzed by SPR in a Biacore 3000 apparatus. (Top and center) The association and dissociation phases for wt RKIP and RKIP(P74L) were monitored for 120 s. (Bottom) The arbitrary response units (RU) at the 115-s point during the association phase were plotted using a one-site competition equation. The graph shows results from three independent experiments ± standard deviations. (D) Kinetics of wt RKIP phosphorylation by ERK2 in the presence of various concentrations of DHPE. (Bottom) Double-reciprocal plot of the data. The Km and Vmax values calculated from the fitting curves were 28.7 ± 2.8 μM and 1,384 ± 72 arbitrary units (AU) without DHPE, 37.2 ± 4.8 μM and 1,280 ± 96 AU with 100 μM DHPE, 36.5 ± 5.7 μM and 1,029 ± 93 AU with 500 μM DHPE, and 39.6 ± 12.0 μM and 873 ± 141 AU with 2,000 μM DHPE, respectively.

