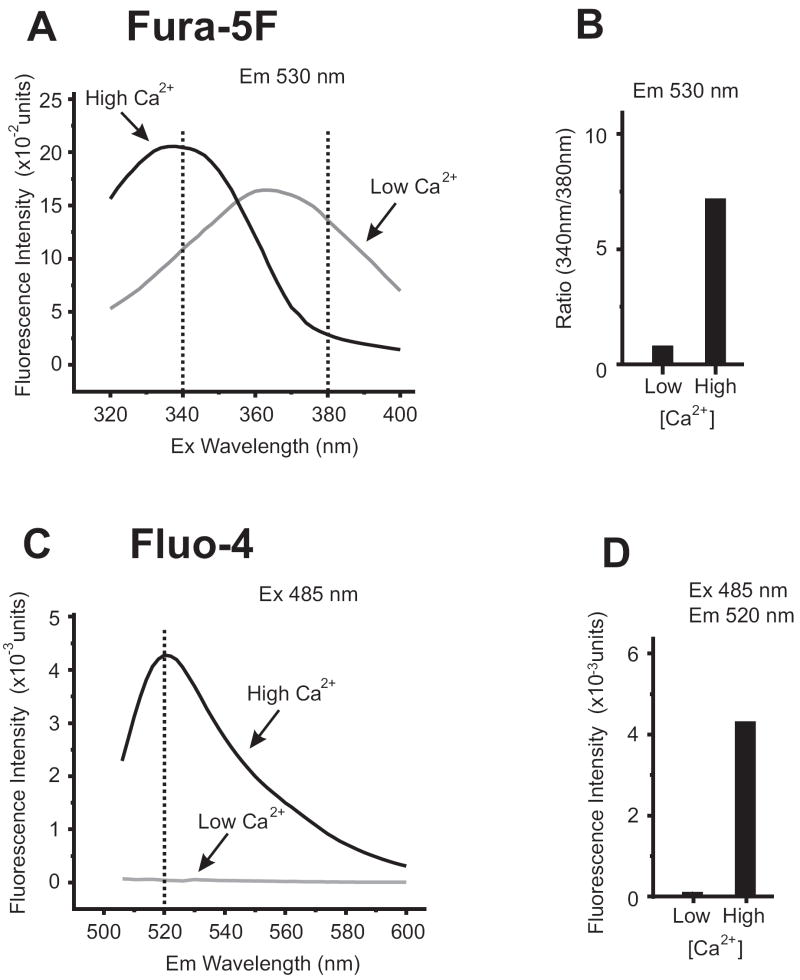
Figure. 1. Spectral Characteristic of Ratiometric and Single Wavelength Ca2+Indicators.
(A) Emission spectra of fura-5F (free-acid form) recorded at 530nm while scanning excitation wavelengths from 320-400nm. With 10 μM fura-5F dissolved in buffer containing 100 mM KCl, 20 mM HEPES, pH 7.2, switching between ‘low Ca2+‘ (buffer +200 μM BAPTA) and ‘high Ca2+’ (buffer + 1 mM CaCl2) conditions demonstrates the spectral shift characteristics of fura-5F. This [Ca2+] change can be quantified by ratioing the emission fluorescence measured at 340nm and 380nm excitation wavelengths, as shown in (B).
(C) Spectra for fluo-4 (free-acid form) was recorded with excitation at 485nm while scanning emission wavelengths from 500-600nm. Using the same buffers as in (A), switching between ‘low Ca2+‘(buffer +200 μM BAPTA) and ‘high Ca2+’ (buffer + 1 mM CaCl2) demonstrates the fluorescence intensity change in the spectra. This [Ca2+] change can be quantified by selecting a single emission wavelength at which the intensity change is maximal, as shown in (D) (measured at 520nm).

