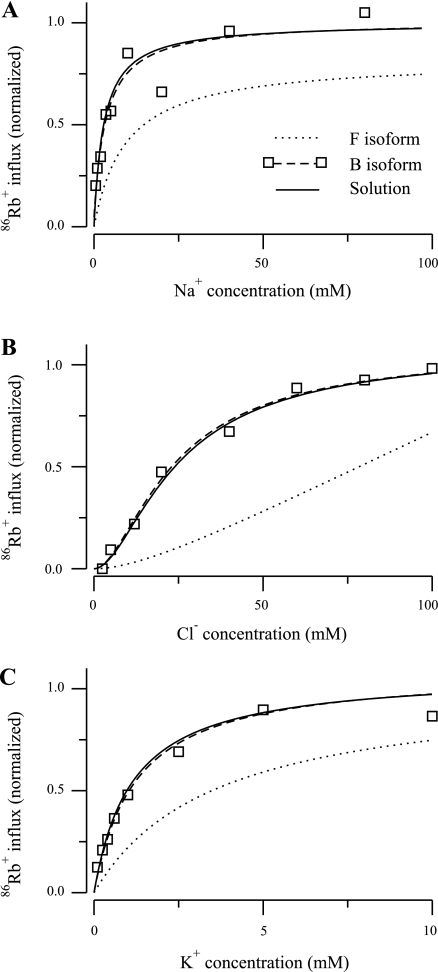
Fig. 10.
86Rb+ influx as a function of ion concentration for the B isoforms of the NKCC2 cotransporter reported in Plata et al. (13). A: Na+ uptake. B: Cl− uptake. C: K+ uptake. Optimal parameters were computed by allowing the off-binding rates for Na+, K+, and Cl− to vary during the optimization process and keeping fixed the other parameters to the optimal values on Table 2 (8 parameters) for the F isoform. The continuous line represents the solution obtained using this process, the dotted line represents the F isoform for the parameters in Table 2 (8 parameters), and the dashed line represents the B isoform for the parameters in Table 2 (8 parameters); squares indicate data values.

