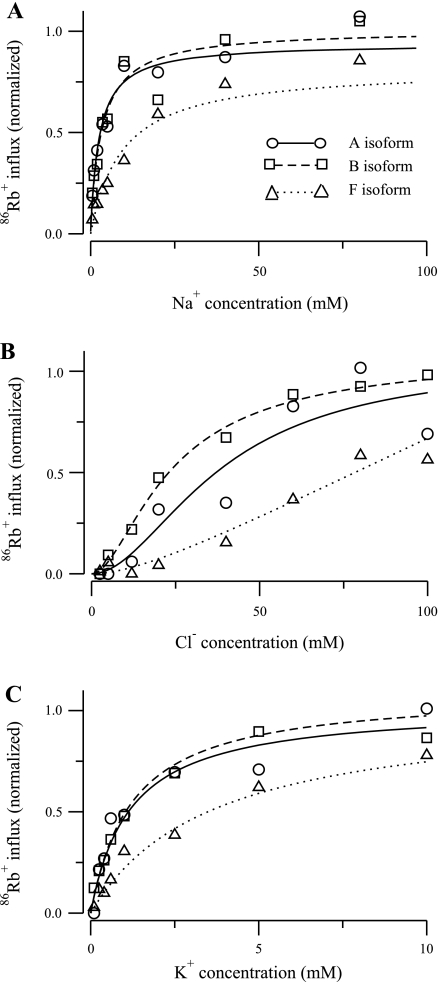
Fig. 2.
86Rb+ influx as a function of ion concentration for 3 isoforms of the NKCC2 cotransporter reported in Plata et al. (13). A: Na+ concentration was varied from 0 to 97 mM and Cl− and K+ concentrations were kept fixed to 110 and 10 mM, respectively. B: Cl− concentration was varied from 0 to 110 mM and Na+ and K+ concentrations were kept fixed to 97 and 10 mM, respectively. C: K+ concentration was varied from 0 to 10 mM and Na+ and Cl− concentrations were kept fixed to 97 and 110 mM, respectively. For the A isoform, the continuous line and circles represent model and experimental data, respectively; for the B isoform, the dashed line and squares represent model and experimental data, respectively; and for the F isoform, the dotted line and triangles represent model and experimental data, respectively.

