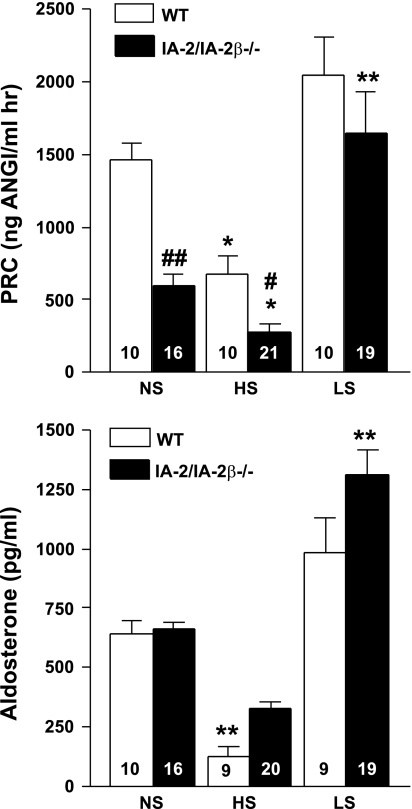
Fig. 6.
PRC (top) and plasma aldosterone concentration (bottom) in WT (open bars) and IA-2/IA-2β−/− mice (filled bars) maintained on diets with normal (NS), high (HS), or low (LS) NaCl content. Numbers inside columns indicate numbers of animals in each group.*P < 0.05, **P < 0.01 compared with NS (ANOVA and Bonferroni's post hoc test). #P < 0.05, ##P < 0.01 compared with WT (ANOVA).

