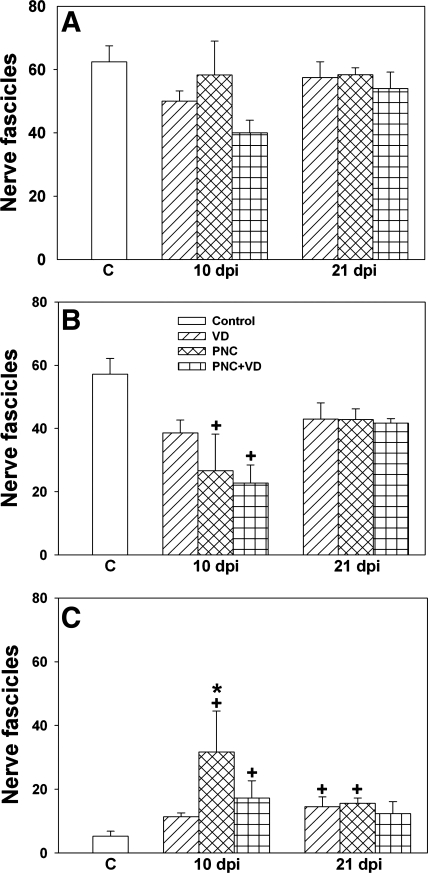
Fig. 6.
Quantification of nerve fascicles near the EUS after injury, including total number of nerve fascicles (A), number of normal nerve fascicles (B), and number of abnormal nerve fascicles (C). C, control; dpi, days postinjury. Values are means ± SE of each experimental group at each time point. +Significantly different compared with control group (P < 0.05). *Significantly different compared with VD group (P < 0.05).

