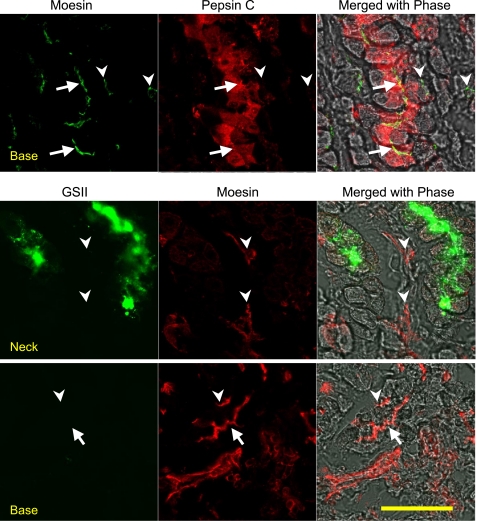
Fig. 9.
Stomach sections confirmed the polarized distribution of moesin along gastric glands. Top: cryosections were stained with mouse anti-moesin and goat anti-pepsin C antibodies followed by the Alexa Fluor 488-conjugated donkey anti-mouse and Alexa Fluor 555 donkey anti-goat antibodies. A typical image of base region is shown. Arrows point to the lumen of the gastric gland (note the moesin staining of chief cell apical membrane), and arrowheads point to moesin staining in the endothelial cells. Middle (neck area) and bottom (base area): cryosections were stained with mouse anti-moesin followed by the Alexa Fluor 555-conjugated goat anti-mouse antibody and Alexa Fluor 488-conjugated lectin GSII. In the neck region (middle) arrows point to the lumen of gastric glands (note the moesin staining of chief cell apical membrane), and arrowheads point to the endothelial cells (also note the moesin staining). Note that the moesin staining in the neck area is always from endothelial cells but not from GSII-positive mucous neck cells. In the bottom from the base region there was no GSII staining, but moesin staining is obvious in the gland lumen (very likely chief cells) as well as endothelial cells. The same magnification was used for all the micrographs: bar = 50 μm.

