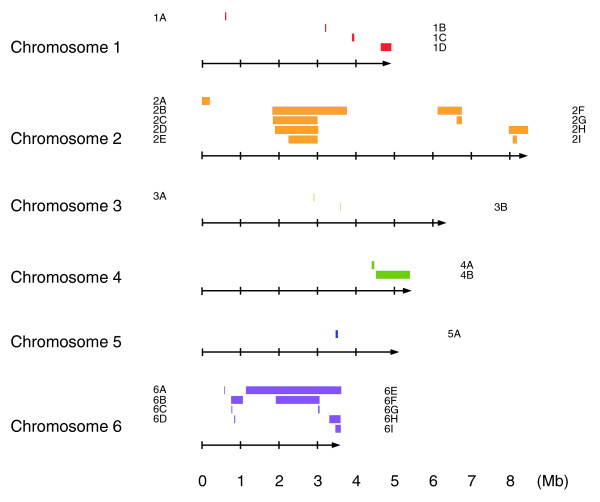
Figure 3.
The distribution of amplifications across the genome. For each chromosome (depicted as arrows, with scale indicating Mb of sequence), different colored bars represent the segments duplicated, approximately to scale. Each feature is named according to the first column of Table 2, in which more precise data concerning size and location are given, along with the strains involved.

