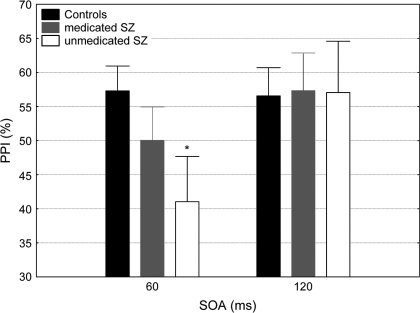
Fig. 2.
Percent Prepulse Inhibition (PPI) at the 2 Prepulse–Pulse Conditions (SOA: 60 and 120 milliseconds) in the Control Subjects, Medicated ,and Unmedicated Schizophrenia Patients. Asterisk indicates significant (P < .01) difference in %PPI compared with the control subjects. Error bars refer to ± standard error of the mean.

