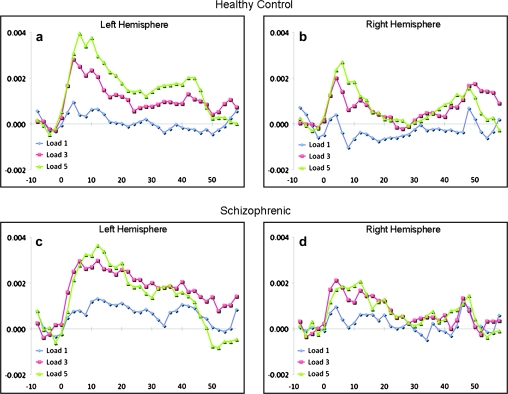
Fig. 4.
The Mean Time Courses of Activation Averaged Across All Voxels Within the Left (a, c) and Right (b, d) Hemisphere DLPFC Regions of Interest for Healthy Controls (a, b) and Schizophrenic (c, d) Subjects. The horizontal axis represents time in seconds relative to the onset of the memorandum at time zero (0) for memory loads of 1 (blue line), 3 (red line), and 5 (green line) items. The first memory probe was presented at 7 sec and the last memory probe occurred at 38 sec.

