
Figure 2.
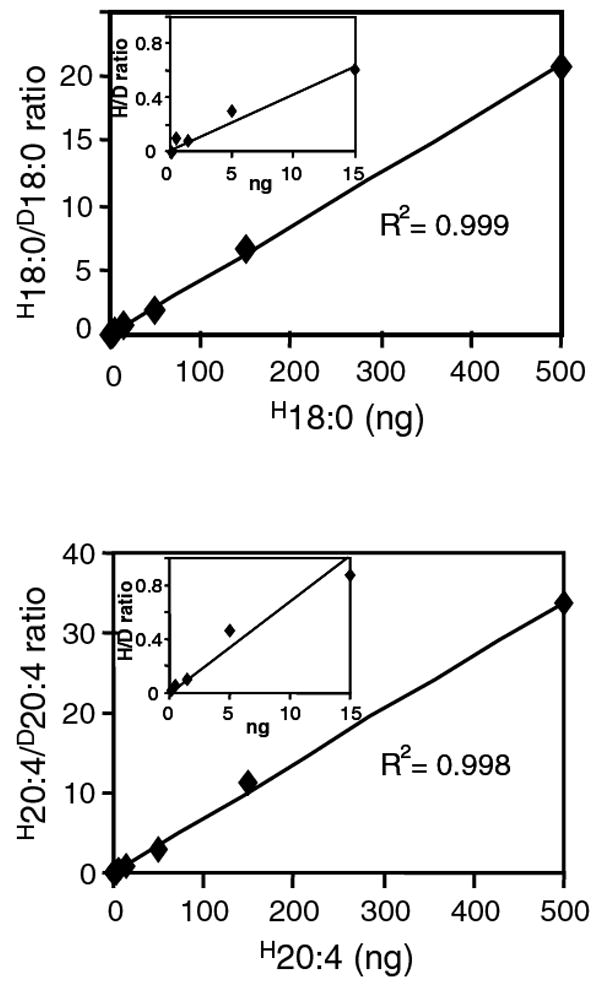
Representative fatty acid calibration curve of saturated and unsaturated fatty acids. Fatty acid standard curves were prepared for each fatty acid by injection of 1 μl of calibration standard mixture containing 0.15 ng to 500 ng of each fatty acid (0.003 ng/μl to 10 ng/μl). For regression analysis, the ratio of unlabeled fatty acid/deuterated fatty acid (H18:0/D18:0, H20:4/D20:4) was calculated as described under “Materials and Methods” and plotted against the absolute amount of unlabeled fatty acid (H18:0, H20:4) in the standard mixture. Inset shows part of the calibration curve at low analyte concentration range. Linear regression parameters were computed and used for quantitative analyses of endogenous fatty acids.