
Figure 3.
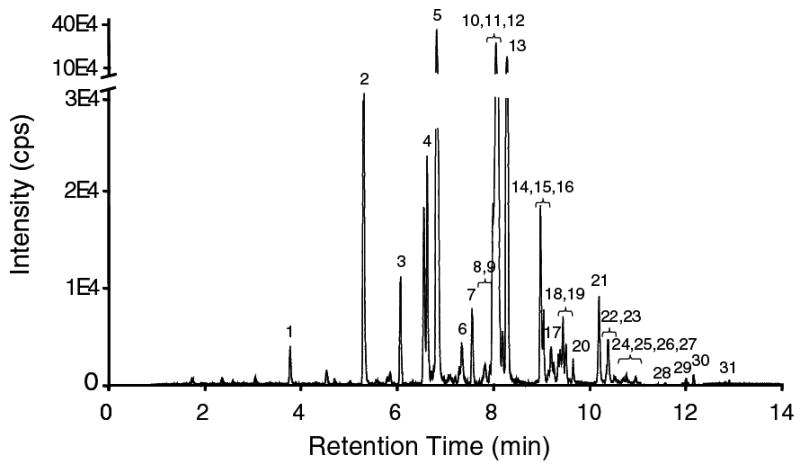
GC/MS chromatogram of cellular free fatty acids extracted from RAW macrophages. The fatty acids were extracted, derivatized and analyzed as described under “Materials and Methods”. No internal standard was added to this representative sample to clearly illustrate the profile of endogenous free fatty acids. For quantification, a mixture of deuterated internal standards was added to the sample prior to the extraction step. The free fatty acid content in the biological sample was calculated from the standard curve using the ratio between analyte peak area and corresponding internal standard peak area. The fatty acids in the chromatogram are referenced as described under Figure 1.