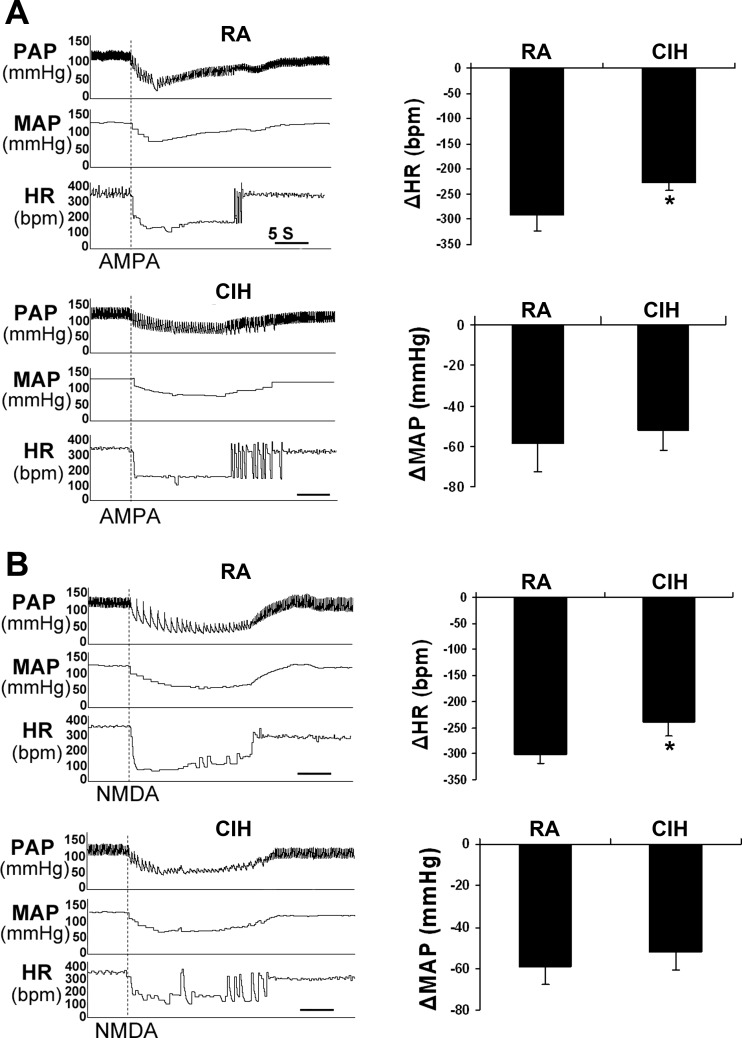
Fig. 3.
HR and MAP responses to microinjections of AMPA and NMDA into the left NA. A: representative responses to AMPA injection in RA and CIH rats (left) and average number of HR and MAP responses (right). B: representative responses to NMDA injection in RA and CIH rats (left) and average number of HR and MAP responses (right). In both cases, CIH significantly reduces the HR responses (*P < 0.05) but not the MAP responses (P > 0.05). n = 6/group.

