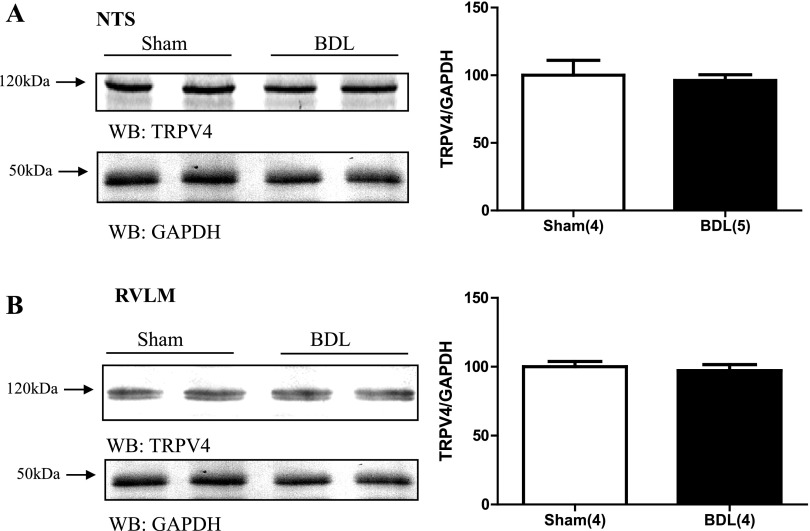
Fig. 5.
Digital images of representative Western blot analysis for TRPV4 from brain punches taken from NTS (A) and RVLM (B) from sham, BDL rats. Graph illustates densitometric analysis of TRPV4 immunoreactivity in sham and BDL. Values are expressed as means ± SE. Numbers in parentheses represent number of animals.

