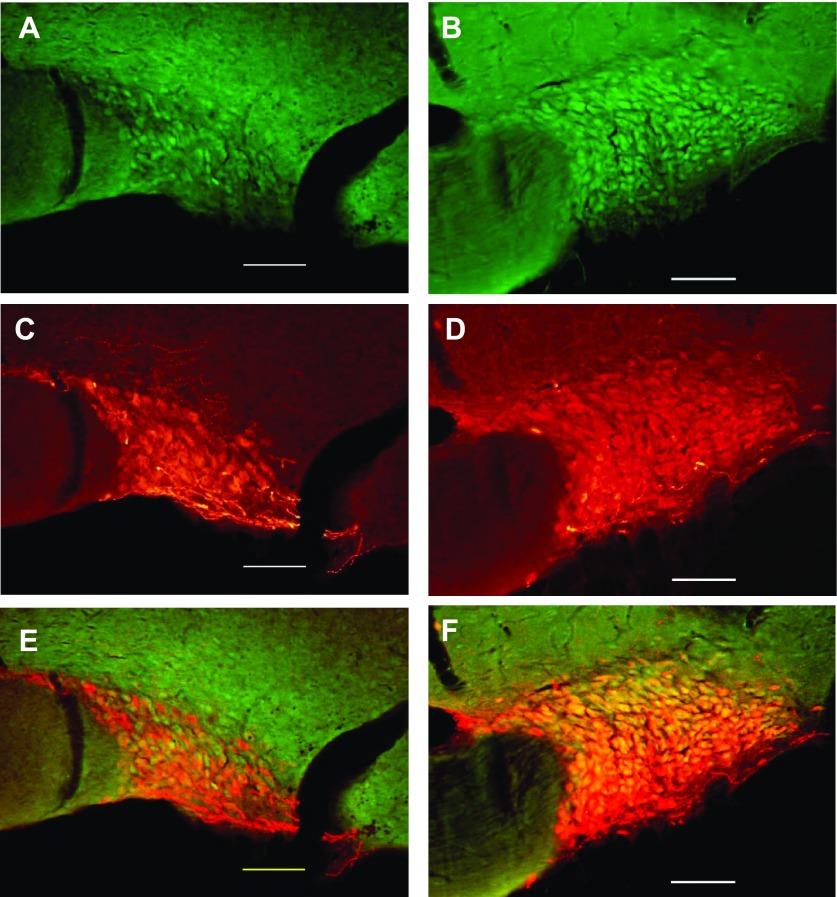
Fig. 6.
Digital images of representative examples of immunohistochemistry for TRPV4 (green: A and B) and AVP (red: C and D) staining in the SON of sham (A and C) and BDL rats (B and D). Merged images (E and F) illustrate colocalization of TRPV4 and AVP in the SON of sham and BDL rats. Scale bar in each image is 100 μm.

