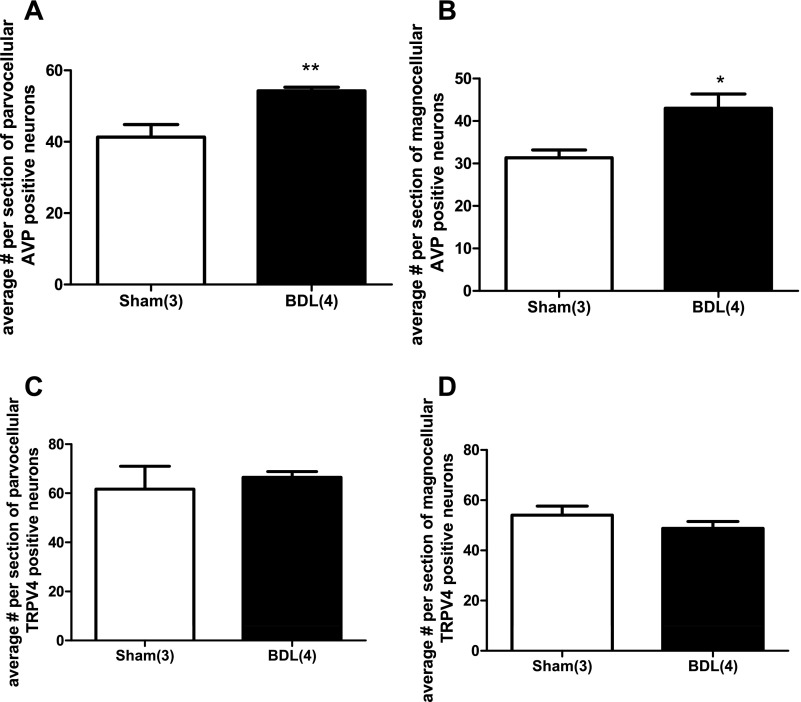
Fig. 9.
Quantitative analysis of changes in AVP and TRPV4 staining in the PVN from sham-ligated and BDL rats. A: average number per section of parvocellular AVP-positive neurons. B: average number per section of magnocellular AVP-positive neurons. C: average number per section of parvocellular TRPV4-positive neurons. D: average number per section of parvocellular TRPV4-positive neurons. *Significantly different from sham, P < 0.01. **Significantly different from sham, P < 0.001. Numbers within parentheses represent number of animals.

