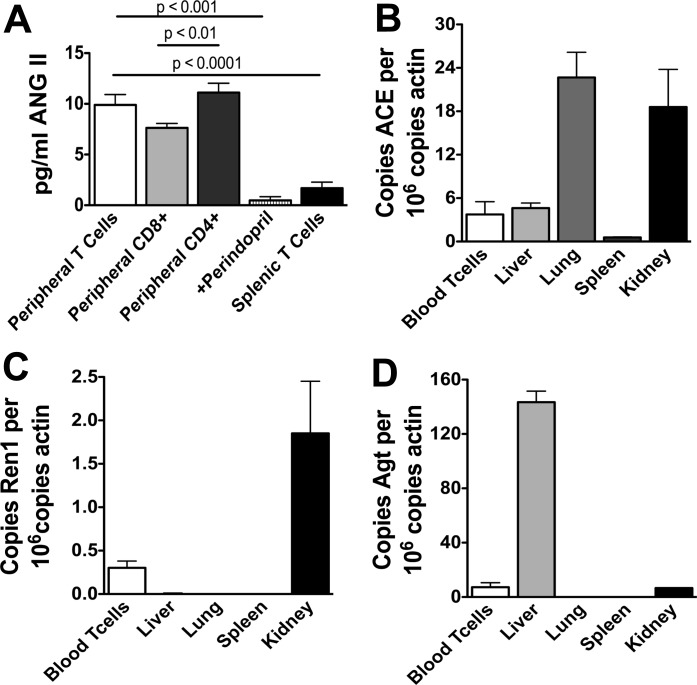
Fig. 3.
Endogenous renin-angiotensin system in T cells. T cells from blood and spleen were harvested and cultured on anti-CD3 plates for 48 h and the release of ANG II into the media by ELISA (A, n = 4–10). In other experiments, T cells and other organs were harvested, and quantitative real-time PCR was used to quantify mRNA of the ANG I-converting enzyme (ACE; B), renin-1 (ren1; C), and angiotensinogen (Agt; D). B–D: mRNA levels in the various cells or tissues is normalized to actin mRNA.

