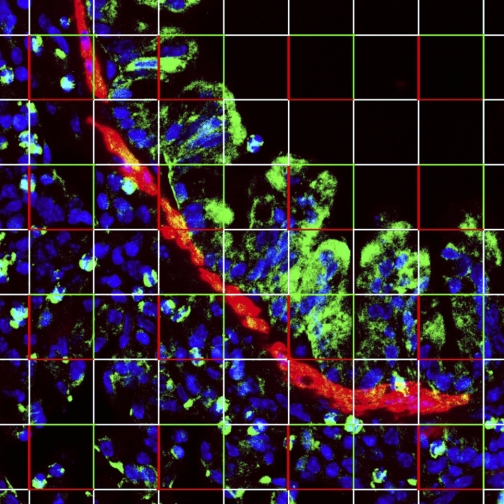
Fig. 5.
OVA treatment increases the number of pGSK (+) ASM. Nuclear counts of α-actin- and pGSK-staining cells were assessed by stereological analyses using an optical disector probe. Nuclei were visualized with Hoechst 33342 (blue), pGSK immunoreactivity (green), and α-actin (red). Colocalization of pGSK and α-actin appears yellow-orange. Using NIH ImageJ, a grid was overlaid on an entire 30-μm-thick z-series stack, as in this figure, and nuclei from α-actin-positive cells were counted as they came into focus through the stack using the optical disector counting rules. Nuclei touching the bright red corners of the indicated squares were not counted, whereas nuclei touching the green borders were allowed. Consistent with stereological counting rules, no immediately adjacent squares were counted. Magnification, ×400.

