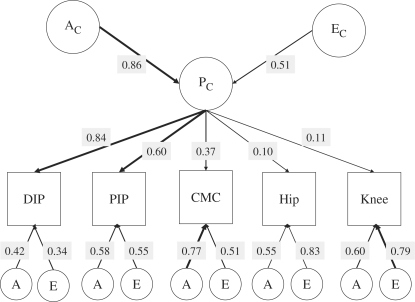
Fig. 2.
Path coefficients of the common pathway model for all five OA variables. The figure shows parameter estimates for the path coefficients of the common pathway AE model, selected as the most appropriate depiction of the data. Thickness of the arrows represents the strength of the association. The squares of the path coefficients provide an estimate of the variance explained by common and specific genetic and environmental components.

