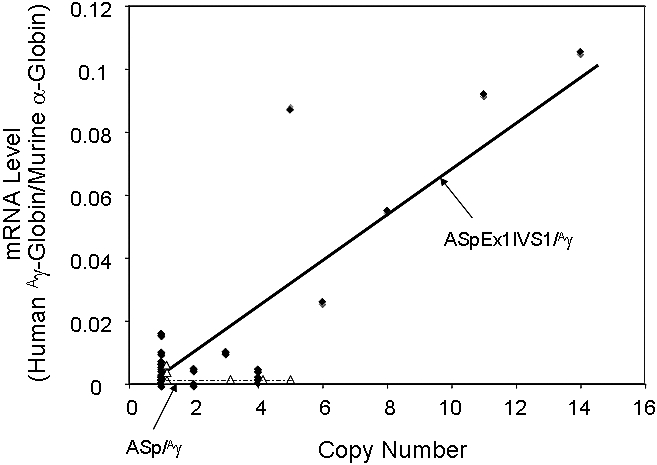
Figure 3.

Correlation of transgene copy number with the levels of α-spectrin gene/Aγ-globin mRNA in ASpEx1IVS1/Aγ-transgenic mice. ●, Linear regression analysis of the transgene copy number with the corrected mRNA expression level was performed with ASpEx1IVS1/Aγ mice; △, ASp/Aγ mice. There is a linear relationship in ASpEx1IVS1/Aγ mice, indicating copy number–dependent expression (r2 = 0.7659, P < .001 for all 23 strains). The lines shown were generated via a “best fit” algorithm with each point weighted equally.
