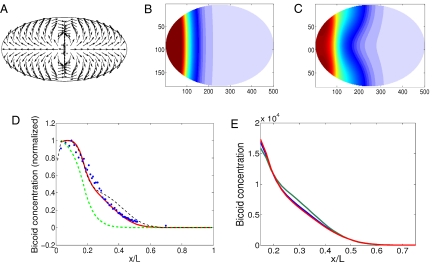
Fig. 2.
Cytoplasmic flow model. (A) Velocity scheme for the fountain streaming stage, cycles 4–6. The velocity direction is given by the arrow in every point and the magnitude is uniform along the embryo. (B) Bicoid concentration in color code (blue, lowest; red, highest) for a cycle 10 embryo, obtained by pure diffusion with D = 0.3 μm2/s. (C) Bicoid concentration in color code (blue, lowest; red, highest) for a cycle 10 embryo, obtained by the flow model. (D) Bicoid profile for a cycle 12 embryo: experimental results from the FlyEx database (23–27) (blue markers) and simulation results: with flow of magnitude 0.08 μm/s (red solid line), flow of magnitude 0.01 μm/s (black dotted line), and diffusion only (green dashed line). (E) Bicoid concentration at cycles 11 (green), 12 (blue), and 13 (red).

