Fig. 3.
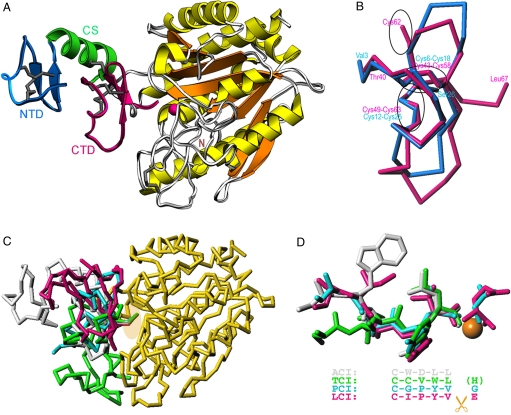
Structure of ACI in its complex with hCPA1. (A) Richardson plot of the complex of ACI (NTD in blue, CS in green, and CTD in magenta) and hCPA1 (α-helices in yellow, β-strands in orange, coils in white) in standard orientation for funnelins (18). Regular secondary structure elements (ribbons for the α-helix; arrows for β-strands) and disulfide bonds are shown for ACI. The catalytic zinc ion of the metalloenzyme is shown as a magenta sphere. (B) Superimposition of the NTD (blue Cα trace) and the CTD (magenta Cα trace) of ACI. The position of the disulfide bonds is pinpointed by ellipsoids. (C) Overlay of the structures of the exogenous inhibitors analyzed to date in complex with funnelins, PCI [cyan; Protein Data Bank (PDB) code 4cpa], TCI (green; PDB code 1zlh), LCI (magenta; PDB code 1dtd), and ACI (white; PDB ID code 3fju), after superimposition of the respective protease moieties. For clarity, only hCPA1 (yellow) in its complex with ACI is further depicted. An ellipsoid pinpoints the C termini of the inhibitors. (D) Close-up view of C in the same orientation showing only the C termini of the inhibitors in the same color as in C. The structural equivalence of the positions of the tails is provided by the alignment. While the terminal residue is severed upon complex formation and occupies the S1′ pocket in PCI and LCI, in TCI it is cleaved but not present in the active site. In ACI it is not cut at all as it occupies subsite S1.

