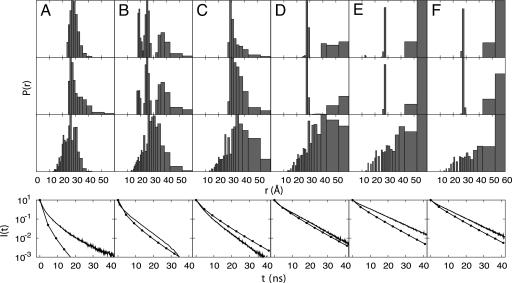
Fig. 2.
Heme–residue distance probability distributions and the corresponding fluorescence decay curves for the GuHCl-unfolded ensemble involving residues (A) 4, (B) 39, (C) 50, (D) 66, (E) 85, and (F) 99. From top to bottom are: the distributions extracted from TRFET measurements under conditions favoring heme misligation in 3.0 M GuHCl at pH 7 (23), the distributions extracted from TRFET measurements without misligation in 3.0 M GuHCl and 0.15 M imidazole at pH 7 (23), the distributions calculated from simulations based on the GuHCl model with nε = 4, and the fluorescence decay curves. The experimental decay curves obtained at 3.0 M GuHCl without misligation are shown in solid lines and the decay curves calculated using the GuHCl model with nε = 4 are shown in lines with dots. See Materials and Methods for more information.

