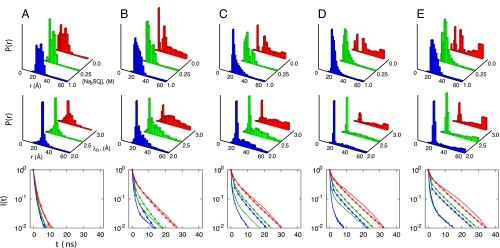
Fig. 5.
Heme–residue distance probability distributions and the corresponding fluorescence decay curves for the acid-induced unfolded ensembles for labeling sites at: (A) 4, (B) 39, (C) 50, (D) 66, and (E) 99. From top to bottom are: the distributions extracted from TRFET measurements at pH 2 and different Na2SO4 concentrations (22), the distributions calculated from simulations based on the acid/salt model with nε = 4 using different Debye screening factors (Å), and the corresponding fluorescence decay curves. The colors of the decay curves correspond to the colors used in the above P(r) distributions with experimental data shown in solid lines and simulation results shown in lines with dots. See Materials and Methods for more information.

