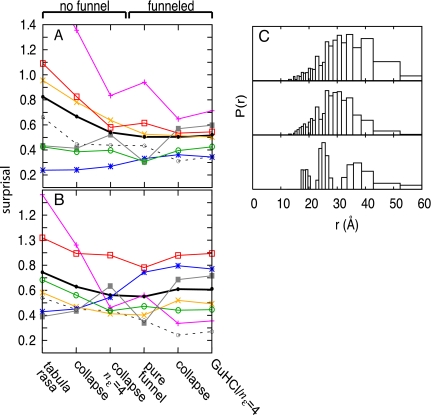
Fig. 6.
A surprisal measure is used to compare the results of several models to the distributions determined from TRFET measurements (A) with misligation and (B) without misligation. Surprisal is a measure of the similarity between two distributions, in which small values imply agreement. The surprisal is plotted as lines for each pair distribution involving residues: 4 (*), 39 (×), 50 (+), 66 (□), 85 (■), and 99 (○). The average surprisals of all heme-residue pairs are plotted as black lines. The average surprisals for all pairs, at distances <30 Å, are plotted as dashed lines. See Materials and Methods for further description of the models and of the surprisal calculation. (C) Heme to residue 39 P(r) distributions calculated from simulations based on the nonfunneled, collapse/nε = 4 model (Top), the funneled GuHCl/nε = 4 model (Middle) and the distribution extracted from TRFET measurements without misligation (Bottom).

