Fig. 3.
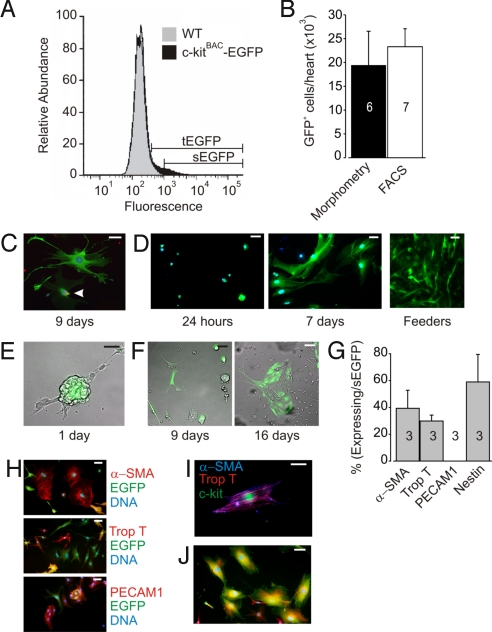
Isolation and expansion of FACS sorted cardiac c-kit-EGFP cells. (A) Representative FACS from PN c-kitBAC-EGFP and WT littermate hearts. WT and EGFP histograms were normalized to same maximum. tEGFP overlaps with brightly autofluorescent WT cells; sEGFP identifies a pure c-kit-EGFP+ population of cells 5 times brighter than background fluorescence. (B) Morphometry and FACS estimate of EGFP+ cells in neonatal hearts. (C) EGFP expression and PCNA (red) staining indicates cycling in c-kit sEGFP+ cells cultured for 9 days in basic media. Arrow indicates PCNA staining. (D) EGFP expressing cells at 24 h (Left) and 9 days (Center) post-FACS. Note differences in cell size and shape. At right tEGFP cells plated on feeders expand rapidly (3 days) in a network pattern. (E) Merged bright-field and fluorescent image show after 1 day in culture some tEGFP cells form clusters. (F) Images taken from the same field of 9 days (Left) and 16 days (Right) post-sEGFP+ plating in basic media shows expansion of cells. Images are merged fluorescent and bright field. Some cells at both 9 and 16 days are no longer fluorescent. (G) Distribution of committed cells 24 h post-FACS (tEGFP cells). Note lack of endothelial cells (PECAM1) and equal distribution of smooth muscle (αSMA) and cardiac cells (troponin T). Nestin staining suggests a population of undifferentiated cells. Number of experiments is indicated in bars. (H) Costaining 9–16 days post-FACS (sEGFP cells). (I) c-kit (green) cell expressing both αSMA (blue) and troponin T (red) markers. Merge of αSMA and troponin T yields purple. (J) Nestin (red) and c-kit (green) costaining in cells cultured for 9 days. (H and I) DAPI staining (blue). (Scale bar: C, 20 μm; D–F, H, and J, 50 μm; I, 10 μm.)

