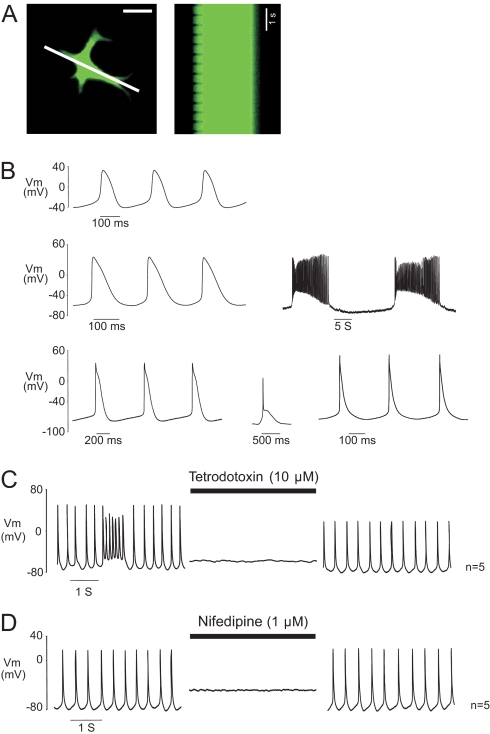
Fig. 4.
Cardiac phenotype of spontaneously beating c-kit+-EGFP cells. (A) Single, contractile EGFP expressing cell at left in single frame from a time series. Line through image indicates area used for sequential scans of fluorescence shown at right. Left edge of line scan shows rhythmic contraction of the top left cell extension at ≈2 Hz. (Scale bar: 25 μm.) (B) APs ranged from nodal-like (Top), to more atrial (Middle) or ventricular (Bottom) morphologies. Note prominent diastolic depolarization phases. Networked c-kit-EGFP+ cells fired rhythmical burst-like activity, interrupted by periods of quiescence accompanied by prominent membrane hyperpolarization. (C) TTX (10 μM, n = 5) or (D) Nifedipine (1 μM, n = 5), reversibly abolished APs.

