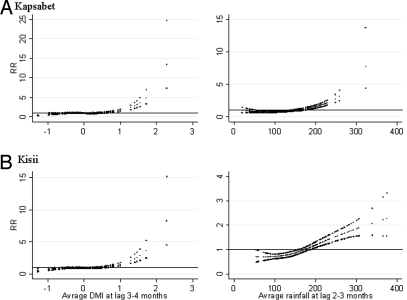
Fig. 2.
Relationships between the relative risk (RR) of malaria scaled to the mean monthly number of inpatients in Kapsabet (A) and Kisii (B) district hospitals and the dipole mode index (DMI) (lag 3–4 months), and the rainfall (lag 2–3 months). The middle line in each graph shows the estimated spline curve, and the top and bottom lines represent 95% confidence limits.

