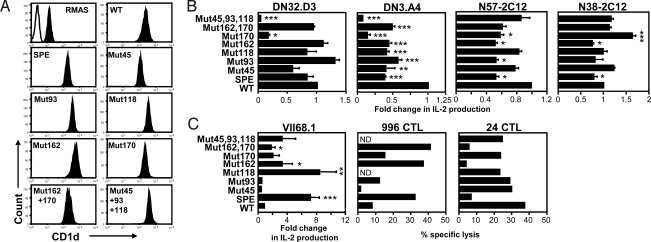
Fig. 5.
Effect of individual CD1d polymorphisms on T cell activation. (A) Histograms depict CD1d expression by various RMAS transfectants. Cells were stained with a control mAb (open) or mAb to CD1d (filled) and analyzed by flow cytometry. (B) Bar graphs depict mean ± SD of fold change in IL-2 production by type I NKT cell hybridomas after stimulation with a panel of RMAS-CD1d transfectants pulsed with α-GalCer (100 ng/mL). IL-2 production by each hybridoma in response to CD1dSPE and specific mutants was normalized to the CD1dWT allele. Bar graphs depict mean ± SD of fold change in IL-2 production obtained from 3 independent experiments. (C) Bar graphs depict mean ± SD of fold change in IL-2 production or percentage-specific lysis of the indicated RMAS-CD1d transfectants by type II NKT cells. E/T ratios are 1:1 and 60:1 for 996 and 24 CTL, respectively. Statistically significant differences: *, P < 0.05; **, P < 0.01; ***, P < 0.001.

