Fig. 1.
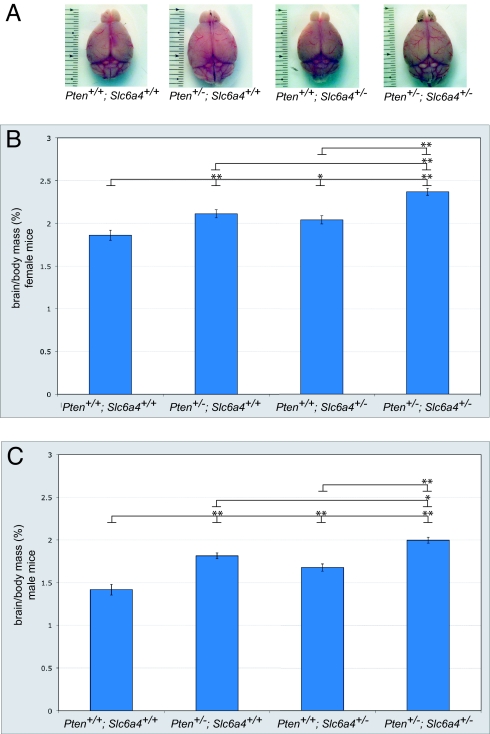
Macrocephaly in Pten+/−; Slc6a4+/− mice. (A) Representative dorsal-view images of brains from male Pten+/+; Slc6a4+/+, Pten+/−; Slc6a4+/+, Pten+/+; Slc6a4+/−, and Pten+/−; Slc6a4+/− mice. Brains were collected at 12 weeks of age. (B and C) As compared to wild-type controls, Pten and Slc6a4 haploinsufficient mice show a significant increase in brain mass. (B) Brain mass in females is significantly increased in Pten+/−; Slc6a4+/− mice as compared to Pten+/+; Slc6a4+/+, Pten+/−; Slc6a4+/+, and Pten+/+; Slc6a4+/− mice (F3,42 = 20.6; P < 0.001). n = 10 Pten+/+; Slc6a4+/+, 10 Pten+/−; Slc6a4+/+, 10 Pten+/+; Slc6a4+/−, and 13 Pten+/−; Slc6a4+/− mice. (C) Brain mass in males is significantly increased in Pten+/−; Slc6a4+/− mice compared to Pten+/+; Slc6a4+/+, Pten+/−; Slc6a4+/+, and Pten+/+; Slc6a4+/− mice (F3,33 = 30.0; P < 0.001). n = 6 Pten+/+; Slc6a4+/+, 6 Pten+/−; Slc6a4+/+, 11 Pten+/+; Slc6a4+/−, and 11 Pten+/−; Slc6a4+/− mice.*, P < 0.05; **, P < 0.01 [Tukey's honestly significant difference (HSD) test]. Ages were 8–12 weeks. Data are normalized to body mass to account for differences in body mass between animals.

