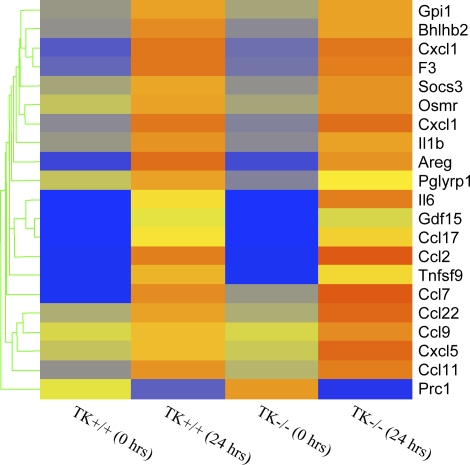
Figure 2.
Cluster analysis of cytokines and chemokines. Genes that are functionally classified as either cytokines or chemokines are ordered by expression pattern. Colored bars indicate relative expression levels. Genes that are expressed at higher levels are assigned progressively brighter shades of red, whereas genes expressed at low levels are assigned shades of blue. The data represent an average of duplicate chips, which were hybridized with RNA pooled from three animals for each treatment group.

