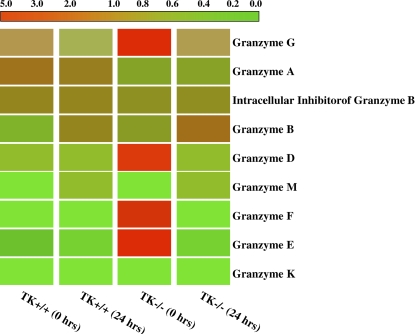
Figure 6.
Cluster analysis of granzymes expression. Granzymes B–M are ordered by expression pattern. Colored bars indicate relative expression levels. The bright red color corresponds to high expression, and green color represents a low level of gene expression. The data represent an average of duplicate chips, which were hybridized with RNA pooled from three animals for each treatment group.

