Figure 1.
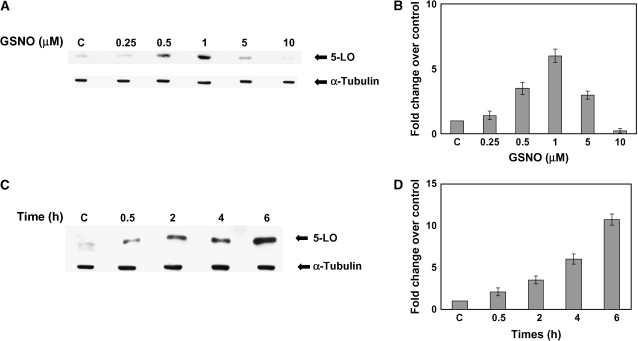
S-Nitrosoglutathione concentrations < 5 μM increase, while those > 5 μM decrease, 5-LO expression in A549 cells (A). Western blot analysis was performed on whole cell extracts made from A549 cells treated with various concentrations of GSNO for 6 h. Membranes were stripped and re-probed with a α-tubulin to verify that an equal amount of protein was loaded. (B) The optical densities of the bands were quantified by densitometry. (C) A time course of GSNO induction of 5-LO expression was also evaluated by Western blot analysis. Twenty-five micrograms protein was loaded in each lane for each experiment (n = 3). (D) The optical densities of the bands were quantified by densitometry.

