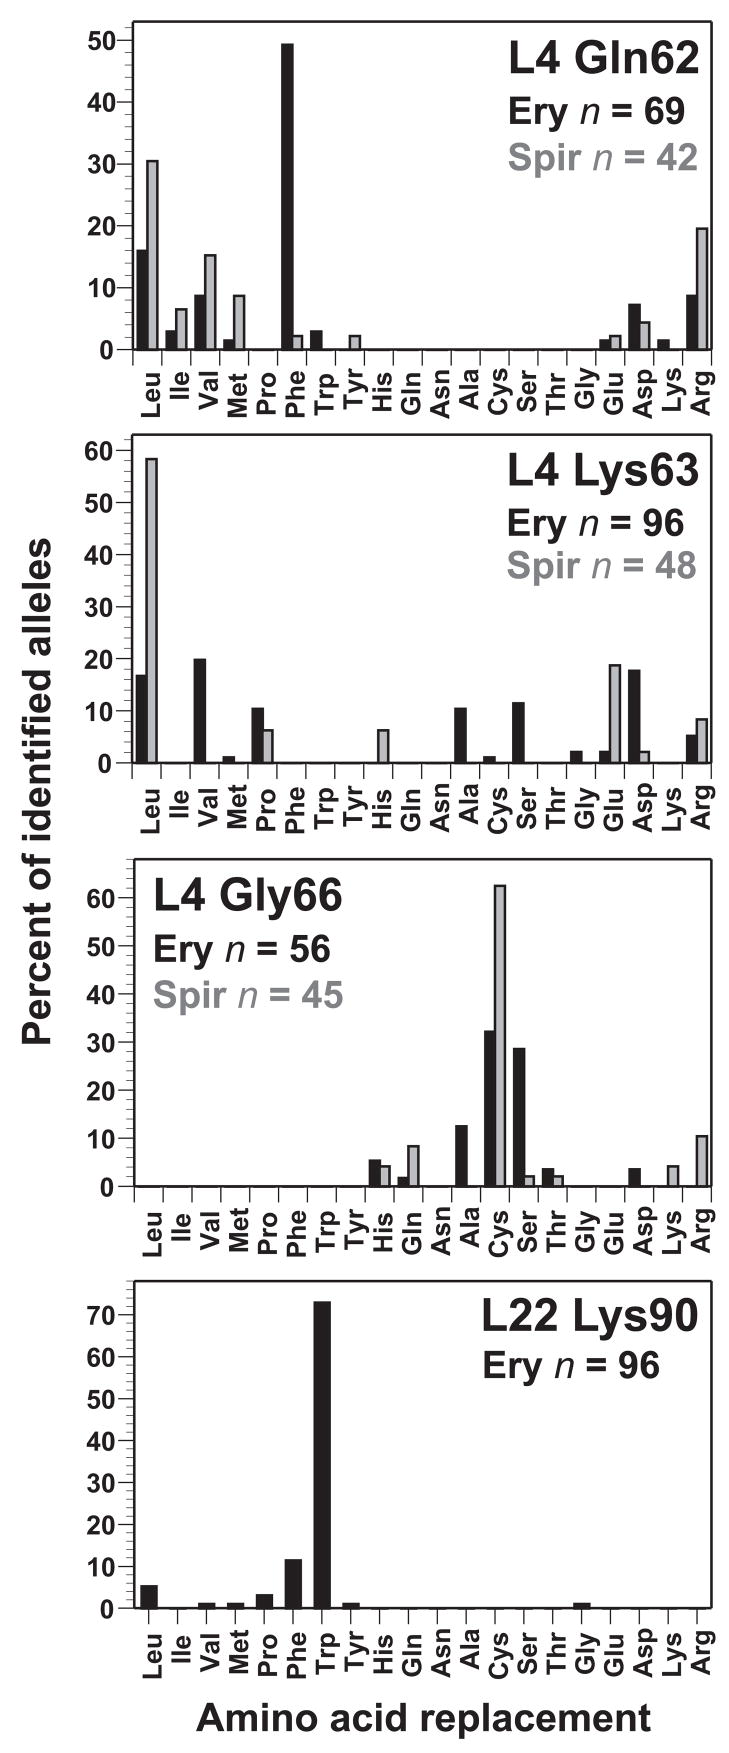
Figure 2.
Isolation frequencies of L4 Gln62, L4 Lys63, L4 Gly66, and L22 Lys90 missense alleles. Frequencies are expressed as the percent of total mutants isolated from each selection. The total number of mutants identified for each position is indicated. L4 Gln62, L4 Lys63, and L4 Gly66 mutants isolated by spiramycin selection are shown in grey. Complex mutations isolated from these libraries are not shown in the histograms, but were included in the calculation of allele frequencies. See Supplemental Tables II & III for a complete enumeration of all isolated mutations.

