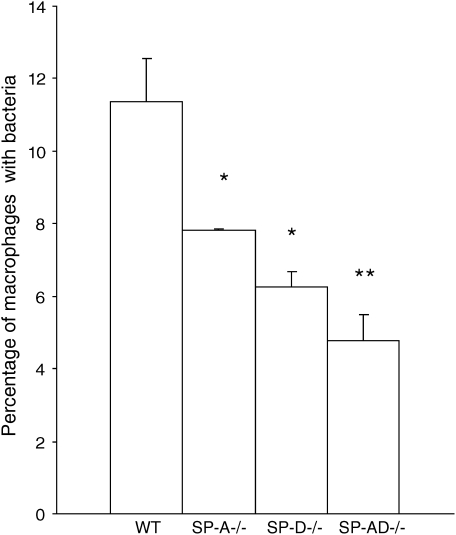
Figure 2.
Phagocytosis by AM in vivo. Phagocytosis of GFP expressing P. aeruginosa was measured in vivo by collecting BALF 1 h after infection. Cytospin preparations were observed under confocal microscopy to quantify the percentage of AM that had intracellular bacteria. The percentage of AM that had intracellular bacteria was the highest in WT mice. It was significantly lower in SP-A−/−, SP-D−/−, and SP-AD−/− mice. There was also a significant difference in phagocytosis between SP-A−/− and SP-AD−/− mice. Data are expressed as means ± SEM with n = 5–7 mice per genotype. *P < 0.05 versus WT mice. **P < 0.05 versus WT and SP-A−/− mice.

