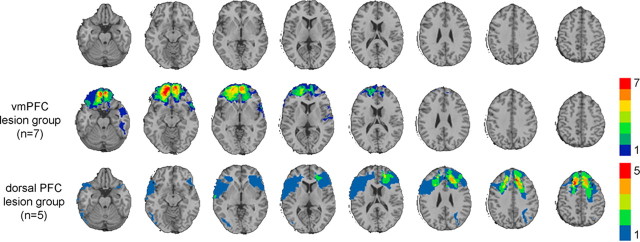
Figure 1.
Lesion overlaps of VHIS prefrontal lesion groups. Color indicates the number of overlapping lesions at each voxel. Top row, Transverse slices of a normal healthy brain, for reference. From left to right, z = −22, −12, −2, 8, 18, 28, 38, and 48. In each slice, the right hemisphere is on the reader's left. Second row, Lesion overlap for the vmPFC lesion group. Third row, Lesion overlap for the dorsal PFC lesion group.

