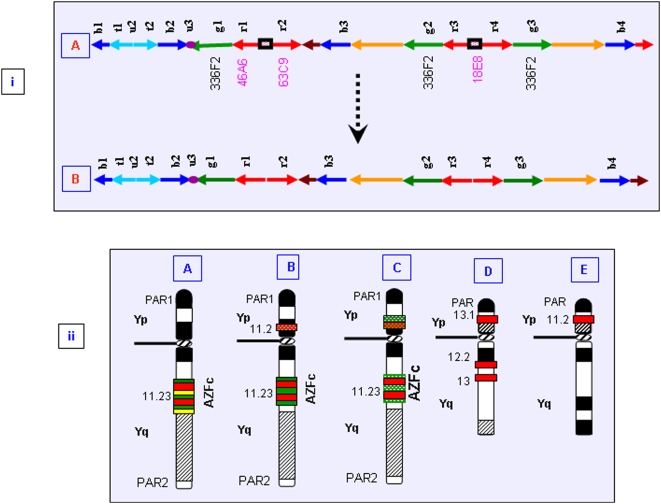
Figure 10. (i), Schematic representation of the AZFc region.
(A) Arrangement of the AZFc amplicons as reported in the literature. Probes used in this study are given below the corresponding amplicons. Cosmids common to all the DAZ genes are highlighted in pink. (B) Arrangement of the AZFc amplicons in the NBR-exposed and control males showing decreased intervening length between the two DAZ genes at each locus. This decrease is hypothesized to be due to translocation of 18E8 sequences onto the Yp. (ii), (A) Diagrammatic illustration showing positions of DAZ genes and neighboring AZFc amplicons reported thus far. Red horizontal bars represent two DAZ loci. The amplicons g1, g2, and g3, detected with BAC 336F2 (probe D) are represented by green horizontal bars. (B) Translocation of probe “A” signal to the Yp shown as red dotted horizontal bar. (C) Duplication of either one or all the g1, g2, and g3 amplicons followed by translocation to the short arm with higher frequency in NBR-exposed males compared to that in normal ones. (D) and (E) represent Y chromosomes of Sumatran orangutan and pygmy chimpanzee, respectively, where DAZ genes are present on the short arm of the Y chromosome. The Yp localization of DAZ genes was not linked with the exposure to NBR, since a similar arrangement was detected in the normal males.

