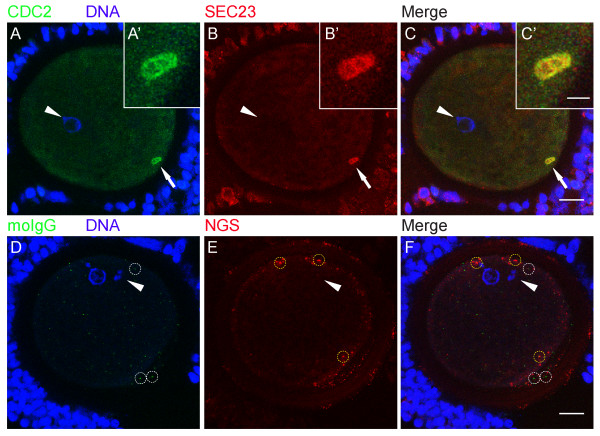
Figure 2.
CDC2 associates with ER exit sites. (A-C) 0 h GV stage oocyte labeled for CDC2 (A, green), DNA (A, blue), and SEC23 (B, red). Colocalization (yellow) of CDC2 and SEC23 in a cortical domain in the ooplasm is evident in the merged image (C). (D-F) 0 h GV stage oocyte from the same experiment as A-C, labeled with mouse IgG (moIgG, D, green), DNA-marker (D, blue), and normal goat serum (NGS, E, red). Aspecific dots of moIgG staining (examples are marked with white circles in D, F) and NGS (examples are marked with yellow circles in E, F) do not colocalize in the merged image (F). Confocal sections from an acquisition depth equivalent to A-C are shown, and enhancements of D-F were identical to A-C. Images are Z-projections of 6 consecutive sections; scale bars represent 20 μm in C and F, and 5 μm in C'. Arrows indicate the region of the oocyte that is shown enlarged in the insets (A'-C'). Arrowheads denote the position of the GV.

