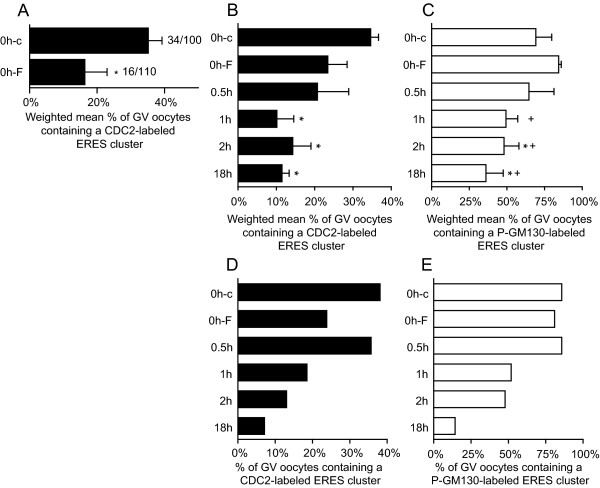
Figure 5.
Inhibition of meiosis resumption prevents association of CDC2 with P-GM130-labeled ERES. (A) Weighted mean percentage ± weighted SEM of GV stage oocytes containing CDC2-labeled ERES clusters after treatment with either DMSO (0h-c) or 100 μM forskolin (0h-F) during the isolation procedure. Data from 3 separate experiments is shown and * indicates significant difference (P < 0.05). Absolute numbers are shown next to the bars (number of positive oocytes/total number of oocytes). (B, C) Forskolin chase bar graphs (n = 3; 20–30 oocytes per group), showing the weighted mean percentage ± weighted SEM of GV stage oocytes containing a cluster of ERES, labeled for CDC2 (B) and/or P-GM130 (C). In one of the experiments shown, an equal percentage of CDC2-labeled ERES was observed in 0h-F and 0h-c groups. As a result, the difference between 0h-c and 0h-F is significant in A, but not in B. The original dichotomous data (presence/absence of an ERES cluster) was analyzed in SPSS using binary logistic regression. All groups were compared to 0h-c and 0h-F conditions for a total of 10 comparisons per label. The familywise significance level was set to 0.05, and was adjusted for pairwise comparisons using the Holm-Bonferroni procedure. Significant differences compared to 0h-c or 0h-F are indicated by * or +, respectively. (D, E) Representative example of a forskolin chase experiment from the series of experiments shown in B, C, showing the percentage of GV stage oocytes containing a cluster of ERES, labeled for CDC2 (D) and/or P-GM130 (E). Note that the increase in the occurrence of CDC2-labeled ERES at 0.5 h after release from forskolin-maintained inhibition of maturation (D) is obscured in the chart showing combined data from three experiments (B), because it occurred at varying time points. Conditions on the y-axis are: 0 h DMSO control (0h-c), 0 h forskolin (0h-F), and 0.5, 1, 2, and 18 h of maturation after forskolin removal (0.5 h/1 h/2 h/18 h).

