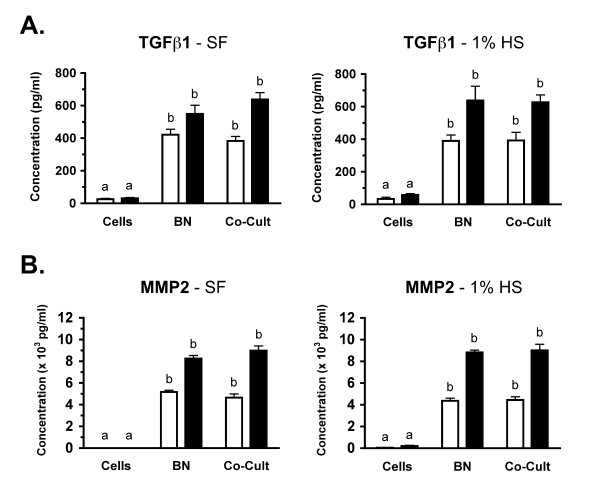
Figure 4.
Secretion of TGFβ1 and MMP2 in cultures. NCTC 2472 fibrosarcoma cells were cultured alone (Cells), neonatal femurs were cultured alone (BN) or these components were cultured together (Co-Cult) and media was collected at indicated times. Across four independent experiments, media was sampled from 8–10 wells for each time point, culture condition and media. A: Media concentration of transforming growth factor β1 (TGFβ1) at day 1 (white bar) and day 2 (black) are shown for both serum-free (left graph) and 1% horse serum (right graph) conditions. Data is graphed as mean pg/ml of TGFβ1 ± SE. B: Media concentrations of matrix metalloproteinase 2 (MMP2) at days and media conditions as in A. Data is graphed as mean (× 103) pg/ml of MMP2 ± SE. For A & B, significance of statistical comparisons between single-component cultures and cocultures where (a) means no significant difference whereas (b) means a significant difference at P < 0.001. Across three independent experiments, media was sampled from 5–6 wells for each time point, culture condition and media.

