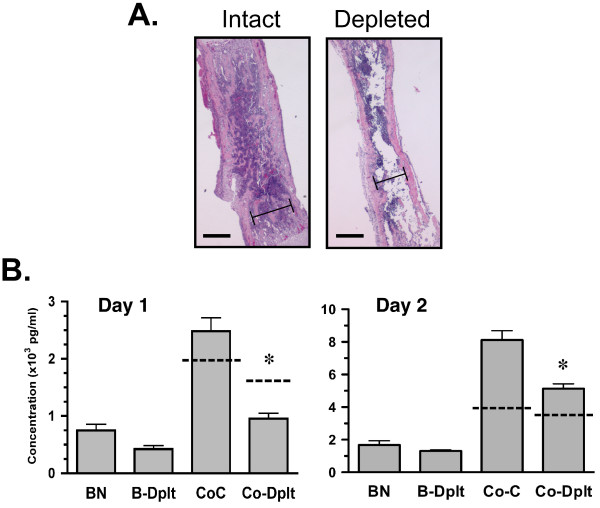
Figure 6.
Marrow depletion attenuates MCP-1 secretion and coculture synergy. A: Photomicrographs of intact and marrow-depleted femurs used in cocultures (4× magnification). The marrow cavity of freshly dissected femurs was flushed using 1 × PBS or left intact and cultured as described. Representative bones were embedded, sectioned and stained with hematoxylin-eosin. Bar = 0.6 mm. Bracket delineates marrow cavity. B: Mean × 103 pg/ml MCP-1 ± SE for day 1 (left graph) and day 2 (right graph) cultures including intact femurs cultured alone (BN), marrow-depleted femurs (B-Dplt), intact femur-fibrosarcoma (Co-C) and depleted femur-fibrosarcoma (Co-Dplt). Dotted line on Co-C and Co-Dplt bar indicate the simple sum of [MCP-1]cells + [MCP-1]BNintact or [MCP-1]cells + [MCP-1]B-dplt respectively. Value for [MCP-1]cells was equal to that shown in Figure 5 as experiments were run in parallel. Across three independent experiments, media was sampled from 7–8 wells for each time point, culture condition and media. Asterisks (*) indicate statistically significant difference between Co-C and Co-Dplt values at P < 0.001.

