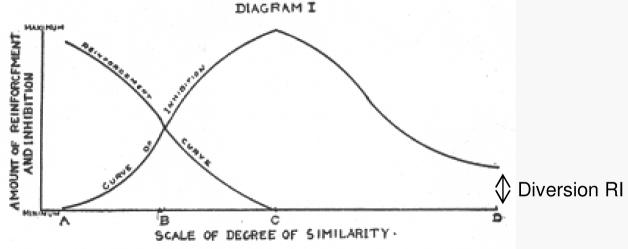
Figure 12.
Skaggs' (1925) diagram of reinforcement and inhibition
Caption quoted from Skaggs (1925): ‘Explanatory Note. – The above diagram is merely theoretical in its outline. Possibly the curves may be drawn with some mathematical precision in the future. The scale on the left vertical represents the amount of reinforcement and retroaction – two opposed processes. The horizontal scale represents the degree of similarity between the original learning and the interpolated work. Beginning at A where learning and work are identical, as we go to the right there is greater and greater dissimilarity until at D the two are as dissimilar in content and method as possible. At A inhibition is at a minimum and reinforcement at a maximum (mere repetition); at C the situation is reversed. At D the inhibition curve has fallen but never to the original minimum’ (p. 32).

