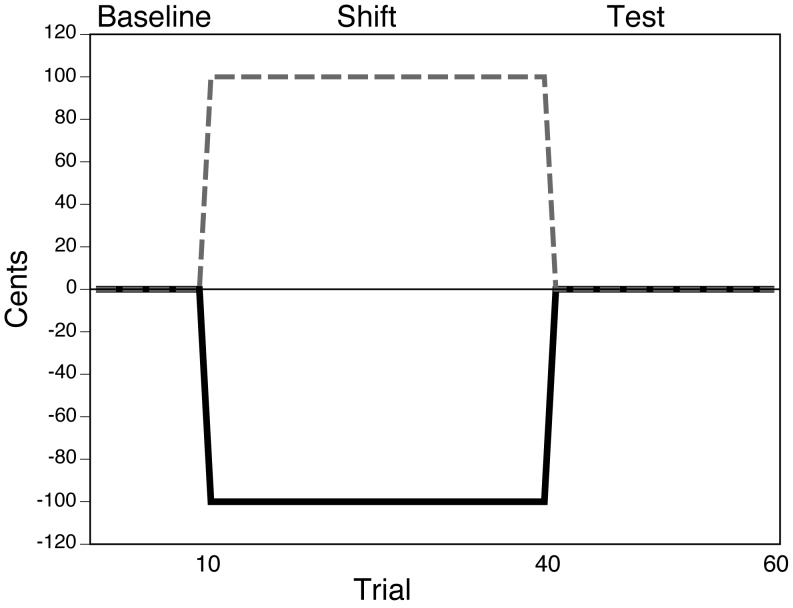
Figure 1.
A schematic depicting the frequency-altered feedback paradigm used in the experiment. The black line indicates the magnitude of frequency shift throughout the experimental session. The gray line represents the fundamental frequency a participant would need to produce to perfectly compensate for the altered feedback.

