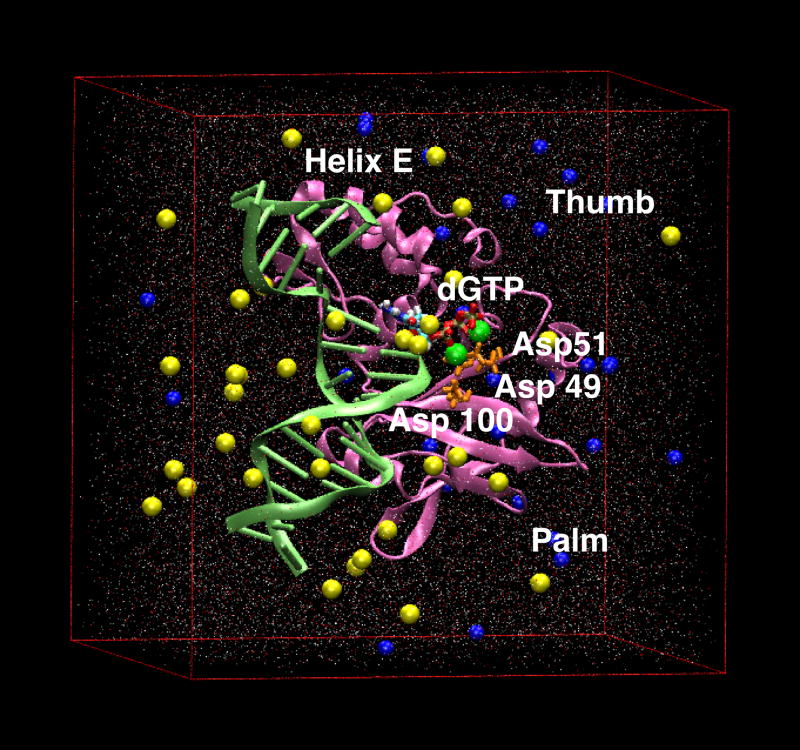
Figure 1.
Starting pol X model for dynamics simulations. Pol X is shown in pink with key residues and areas highlighted. The catalytic triad (Asp 49, 51 and 100) is shown in orange. The incoming nucleotide, dGTP is colored by atom, the two divalent Mg ions are green and the gapped DNA, in light green is cartooned. The box of water molecules, colored by atom, is also shown as well as counter ions (Na+ in blue and Cl− in yellow) placed to achieve physiological ionic strength.

