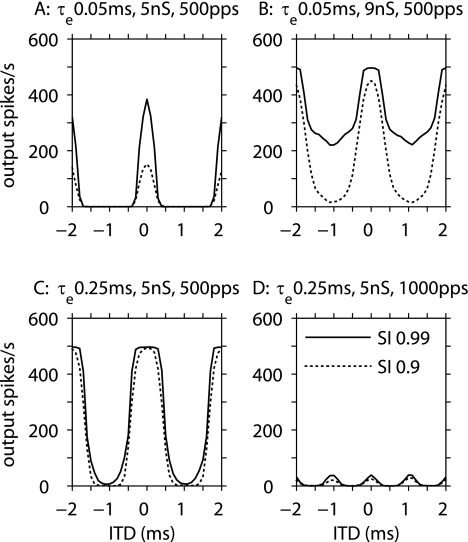
FIG. 3.
Rate–ITD functions in three model MSO cells, showing the effects of synaptic time constants (τe), in relation to input synchrony, synaptic strength, and input frequency fin. Model cells with faster synaptic time constants are more sensitive to input synchrony, whereas those with slower synapses are more sensitive to input frequency. Aτe = 0.05 ms, Ge = 5 nS, fin = 500 Hz; Bτe = 0.05 ms, Ge = 9 nS, fin = 500 Hz; Cτe = 0.25 ms, Ge = 5 nS, fin = 500 Hz; Dτe = 0.25 ms, Ge = 5 nS, fin = 1,000 Hz. The legend showing the input SI values (0.9 and 0.99) in (D) applies to all panels. The average input spike rate of 350 spikes/s for each of the 20 inputs was maintained for every condition shown in this figure.

