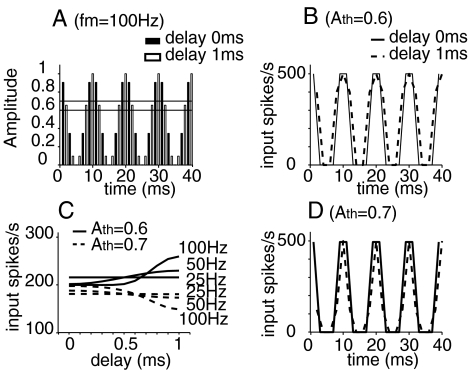
FIG. 7.
The influences of fine-structure delays on the input-rate function. A Pulse trains with delays of 0 and 1 ms sample the envelope of the SAM waveform at different points. For purposes of illustration, no amplitude variation is added  ; the pulse rate is 500 pps and fm is equal to 100 Hz. B, D Different fine-structure delays lead to different shapes of input-rate functions r(t), illustrated here for two threshold values, 0.6 and 0.7, and with
  fixed at 0.1 and fm = 100 Hz. C Variations of Rave with fine-structure delays are stronger for 100-Hz modulated inputs than 25-Hz and 50-Hz inputs. In the average-input-rate plots, parameter values are
  and Ath = 0.6 for solid lines and are
  and Ath = 0.7 for dashed lines.

