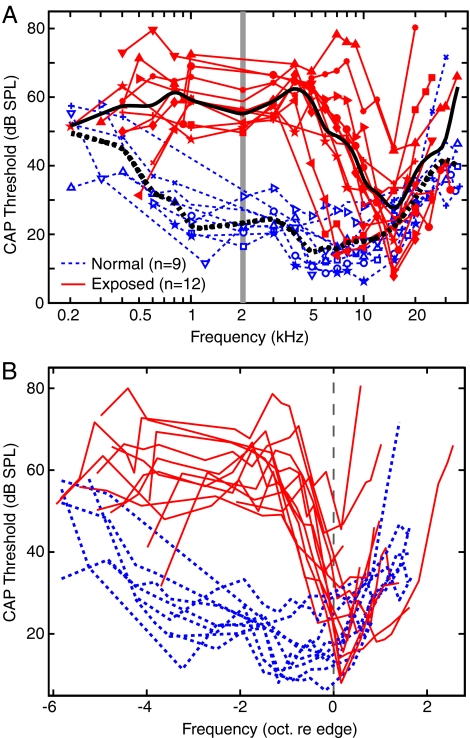
FIG. 1.
CAP audiograms in the normal and noise-exposed experiments. A The light lines show CAP audiograms from individual experiments, and the heavy lines are averages for the normal (dashed lines) and exposed (solid lines) animals. The vertical bar shows the frequency of the noise exposure. B CAP audiograms from individual experiments shifted to align their edge frequencies with the geometric mean value (11.3 kHz). Audiograms from normal animals are also aligned at 11.3 kHz.

