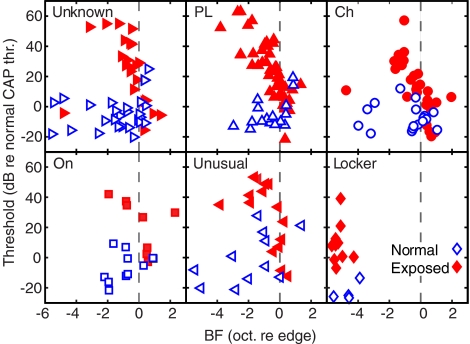
FIG. 2.
Thresholds at BF of neurons of various response types plotted against BF relative to the edge of the CAP audiogram. The thresholds are presented as dB relative to the thresholds in the average CAP audiogram of the normal group (Fig. 1). Symbols identify neuron types; these are the same as in subsequent figures. Filled symbols are from exposed animals, and unfilled symbols are from normal animals.

